Your customers always know the status.
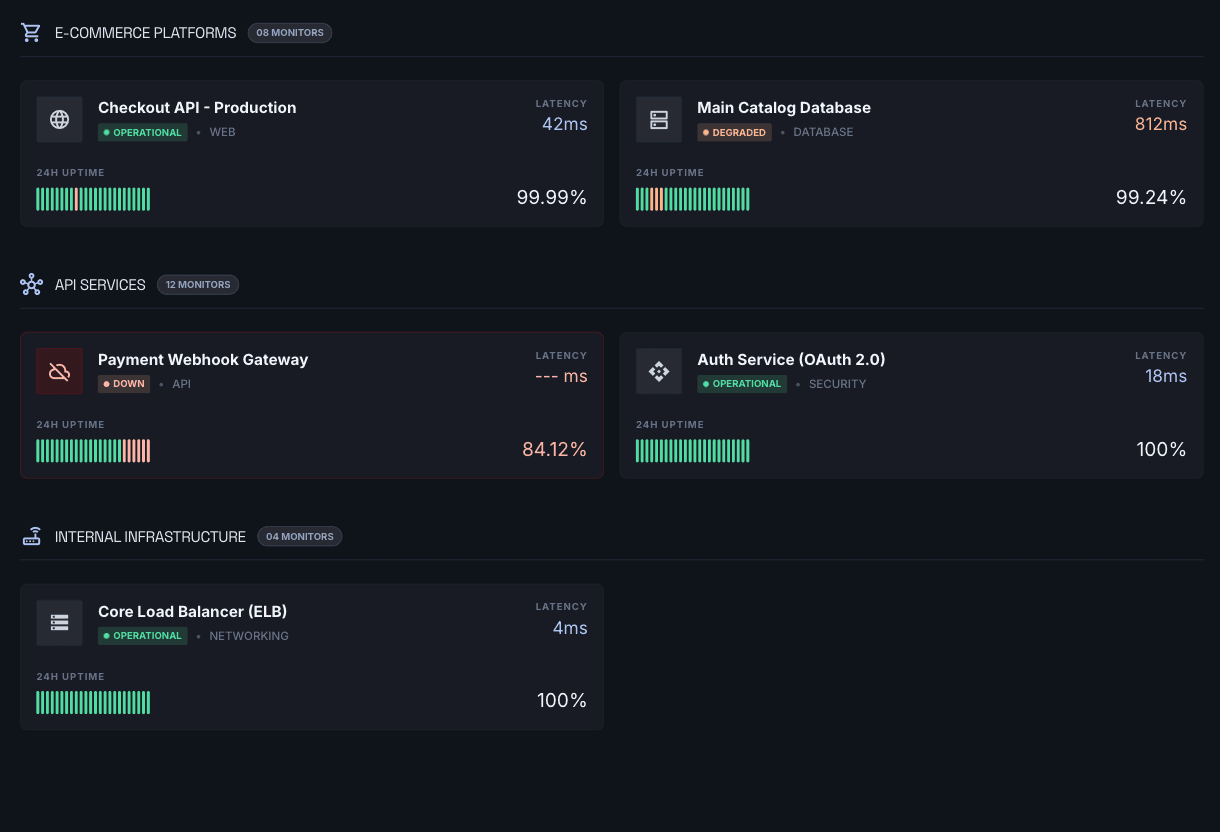
Verulon provides a clear uptime dashboard where you and your customers can see the availability of all systems at a glance — categorised, with live statuses and historical uptime figures.
This is what your status page looks like
Features
Everything you need for transparent uptime
Not a separate tool from a third party you have to configure yourself: uptime monitoring is part of your Verulon hosting, runs on the same Dutch infrastructure, and is ready to share with your customers.
Grouped by category
Monitors are neatly organised into categories such as E-commerce, API Services or Internal Infrastructure — fully configurable via your dashboard.
Live status & latency
Every monitor shows in real time whether the system is operational, degraded or offline, along with the current response time in milliseconds.
24-hour uptime percentage
A graphical uptime bar gives instant visual insight into the stability of each system over the past 24 hours.
Manage it yourself via your dashboard
You configure monitors, labels and categories yourself via the Verulon customer dashboard. No technical knowledge required.
Sovereign Hosting
Part of our complete hosting platform.
Uptime monitoring is included with Verulon Sovereign Hosting. Your applications run on servers in the Netherlands, soon also in Denmark, managed by Dutch engineers — and your customers can see that too.
View hosting packages99.9% uptime guarantee
Backed by redundant infrastructure in data centres in the Netherlands.
Configure monitors as you like
Add monitors, assign them to categories and give them labels via your customer dashboard.
Transparency for your customers
Share the status page directly with end customers without any extra configuration.
Ready to show your customers everything is running smoothly?
Schedule a free intro call and we'll show you what the platform looks like for your specific situation.
Schedule a demo →